Home / Cases / Renard Bakery
CASE STUDY · RENARD BAKERY · BRUSSELS

From a one-day audit to the bakery's command center.

Renard Bakery was about to open a second store. Every number they needed was sitting in the register system, and nobody could pull it out in a form they could read. Less than five months later, management opens one app on their phones every day. It shows yesterday's sales, the forecast for the week ahead, and what to bake more of tomorrow. Here's how we got there, from the first audit day to today.

Client in Brussels, BelgiumProject run in DutchScreens translated to English for this page
1audit day at their production kitchen
8 weeksfrom audit to a first version online
8screens, in Dutch and French
22 monthsof sales history behind the forecast
Renard Bakery platform · demo data

Real screens, made-up numbers  Every screenshot on this page comes from the platform as it runs today, filled with made-up data. Renard Bakery's real numbers stay with Renard Bakery. The team works in Dutch and French, so we switched the labels to English for this page.

How the numbers reach the screen every day
  1. 1Registers, Deliveroo and the weather
  2. 2Pulled in every night
  3. 3Seven checks on the data
  4. 4Forecast and advice calculated
  5. 5On management's phones
Read the full storyWhere things stood · The audit day · What they chose: fewer things, done deeper
01

Where things stood

Renard Bakery is an artisan bakery in Brussels. Everything is baked in one central kitchen. In June 2026 they had one store in Ixelles and a second one in Uccle set to open two months later. They also deliver to businesses, sell through an online store, and take orders on Deliveroo. They're open seven days a week.

The bread was great and the business was growing. The trouble was that it all ran on what a few people kept in their heads. How much to bake came down to experience and gut feel. Nobody tracked what was left at closing time. The register system had all the data, but getting a simple answer out of it, like what a given day brought in, meant digging through reports that take training to read.

That works with one store. Add a second store, four sales channels and a staff that keeps turning over, and it stops working.

02

The audit day

On June 24 I spent a day in their production kitchen. I didn't bring slides. I watched and asked questions. How do orders come in? Who decides what gets baked? Where does the time go? Which tools are they already paying for, and what do those cost?

A week later they had my report. It named five areas where time and money were leaking:

  • Forecasting and waste: production runs on gut feel, and nobody measures leftovers.
  • Financial visibility: the data is all in the register system, but there's no daily picture.
  • Staff scheduling: a large, rotating crew gets scheduled through scattered messages.
  • Customer communication: reviews and newsletters are handled by hand, when they're handled at all.
  • Know-how: every new hire gets the same walkthrough from scratch.

The same thing kept coming up: what the business knew lived in people's heads instead of in a system. Every proposal I made came back to getting that knowledge out, so the chaos doesn't grow along with the company.

The report closed with ten priorities in order, a review of their tools and subscriptions, and three proposals: a light starter package with quick wins, a full ecosystem, and everything combined in one app.

03

What they chose: fewer things, done deeper

What happened next is the part I still think about. They passed on the biggest package, and they passed on the quick wins too. They cut everything that was nice to have and kept the two heaviest pieces: financial visibility and forecasting, in one app on their phones, with training included so the team would really use it.

I think that was a smart call. An audit puts the whole menu in front of you. Then you have to pick what comes first and let the rest wait.

We had a signed agreement on July 13 and held the kickoff four days later.
Sound familiar?

The numbers exist somewhere, but you can't get a clear answer out of them, and the business runs on what a few people keep in their heads. That's where an audit starts.

Tell me where you're stuck →
04

What we built.

We built them their own platform instead of another dashboard bolted onto the register system. It has a login, a database that updates automatically from their source systems, and a calculation layer that works out every number before it shows up on a screen. Register sales, Deliveroo, weather and school vacations all feed into it.

Real screens, made-up numbers

01

The daily overview

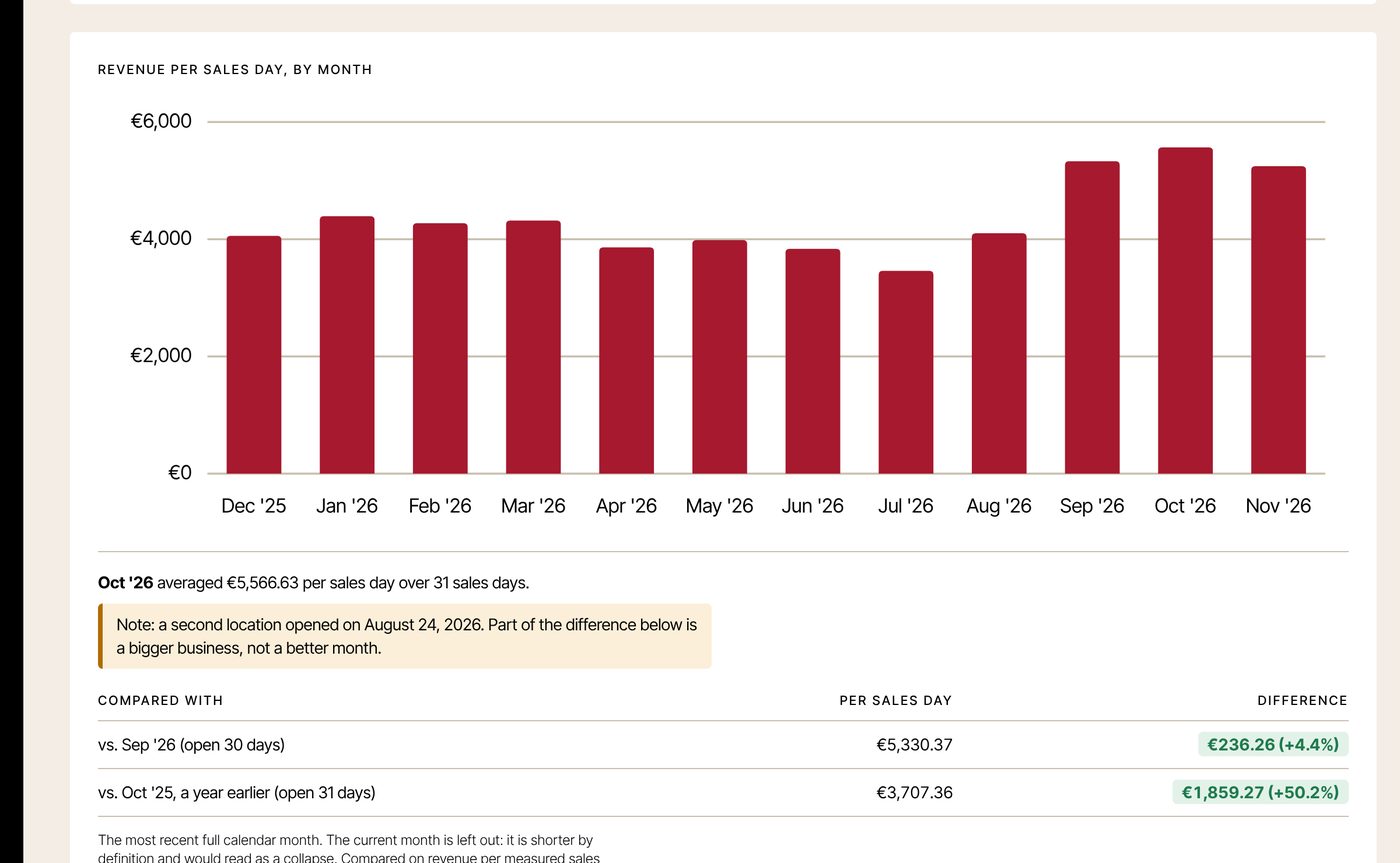
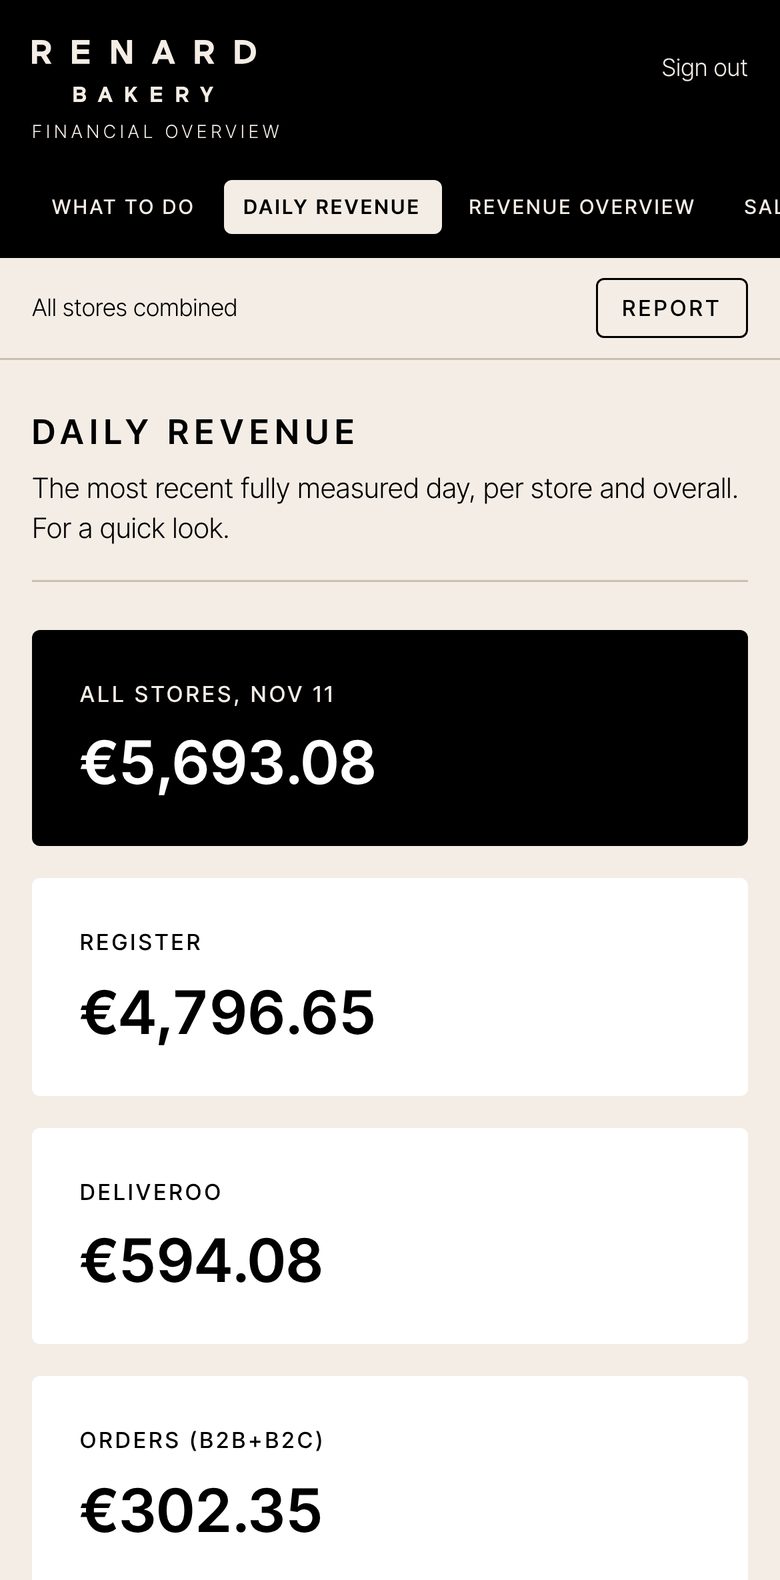
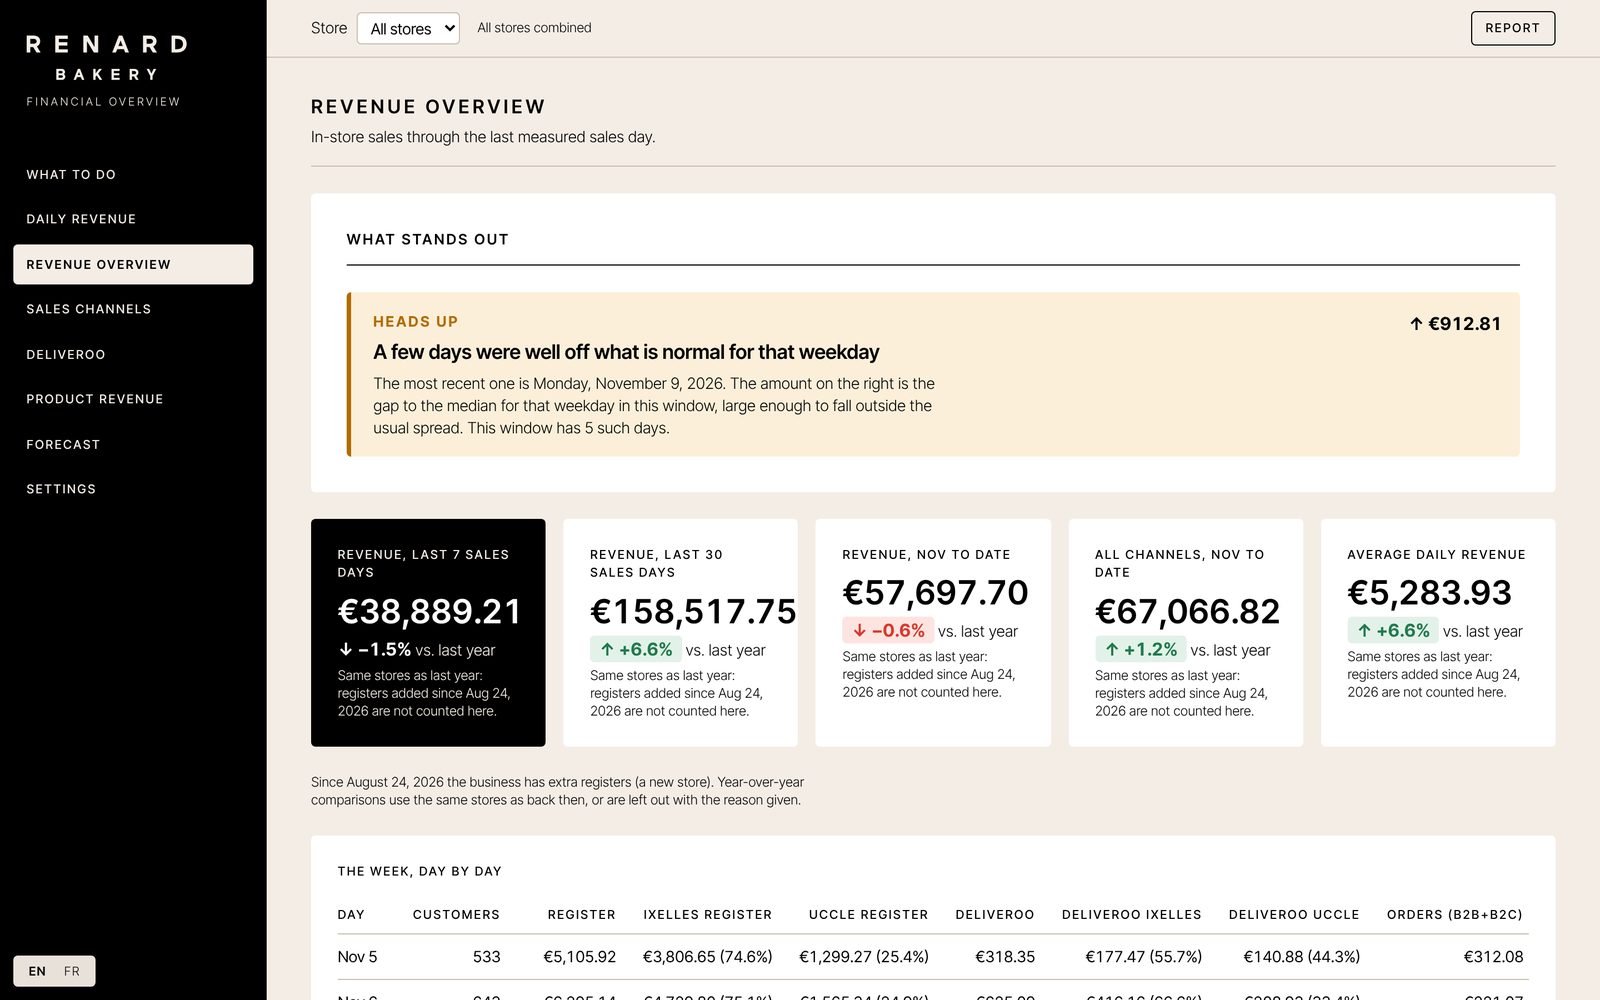
Sales for yesterday, the past week and the month, by store or combined. You get the comparison with last year, the pattern by day of the week, the customer count and the average ticket. A short plain-language briefing sits at the top: what's fine, what to keep an eye on, what needs action.

Renard Bakery platform · demo data
The platform's daily overview with key figures and sales trend, loaded with demo data
02

Each channel on its own

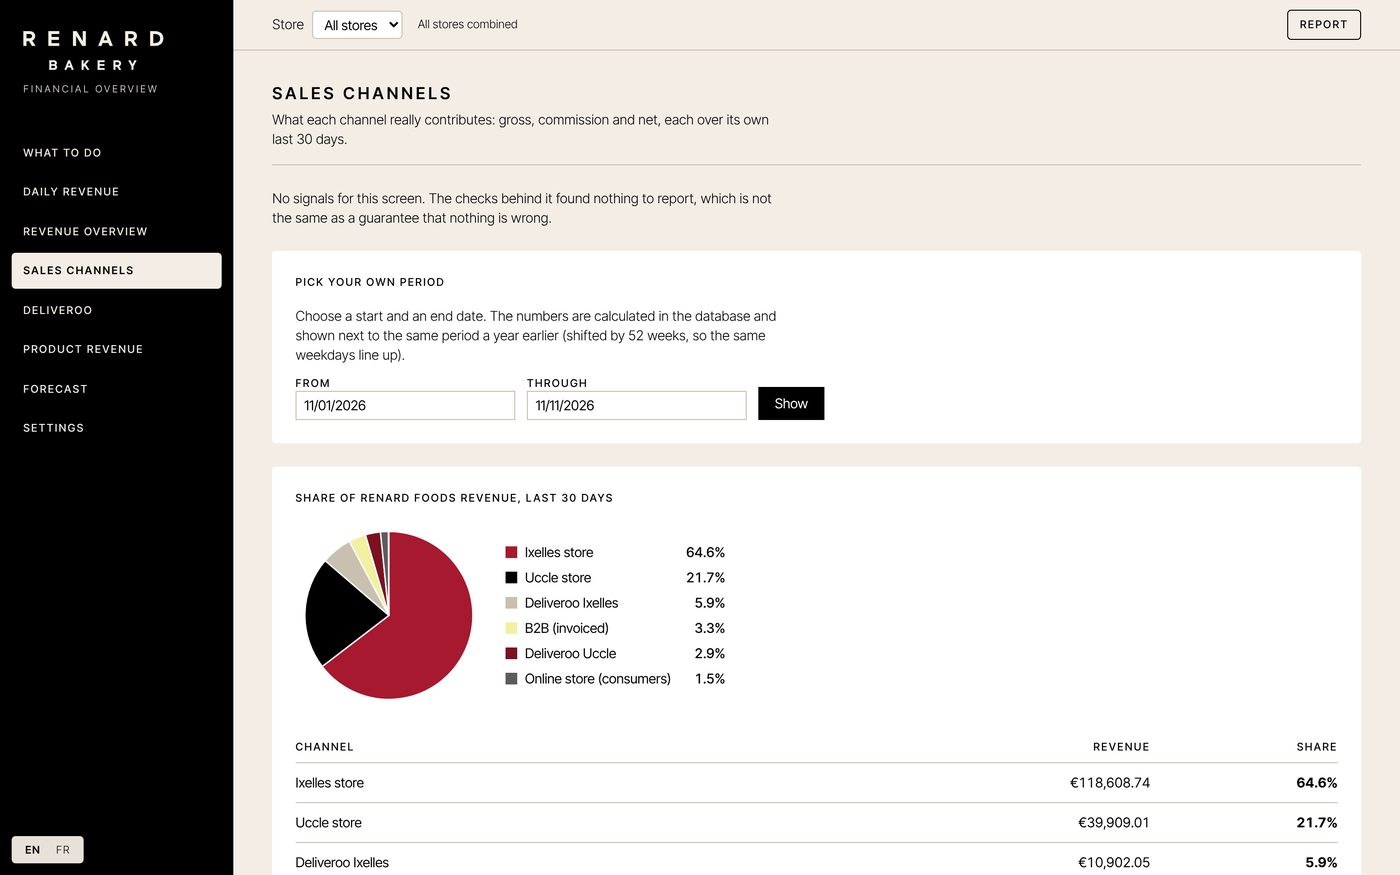
In-store, Deliveroo, B2B and the online store, side by side. For Deliveroo you see what's left after commission as well as the sales. Since October the orders flow in directly through a Deliveroo integration, so nobody uploads files anymore.

Renard Bakery platform · demo data
Sales channels screen showing in-store, Deliveroo, B2B and online store, demo data
03

What sells and what doesn't

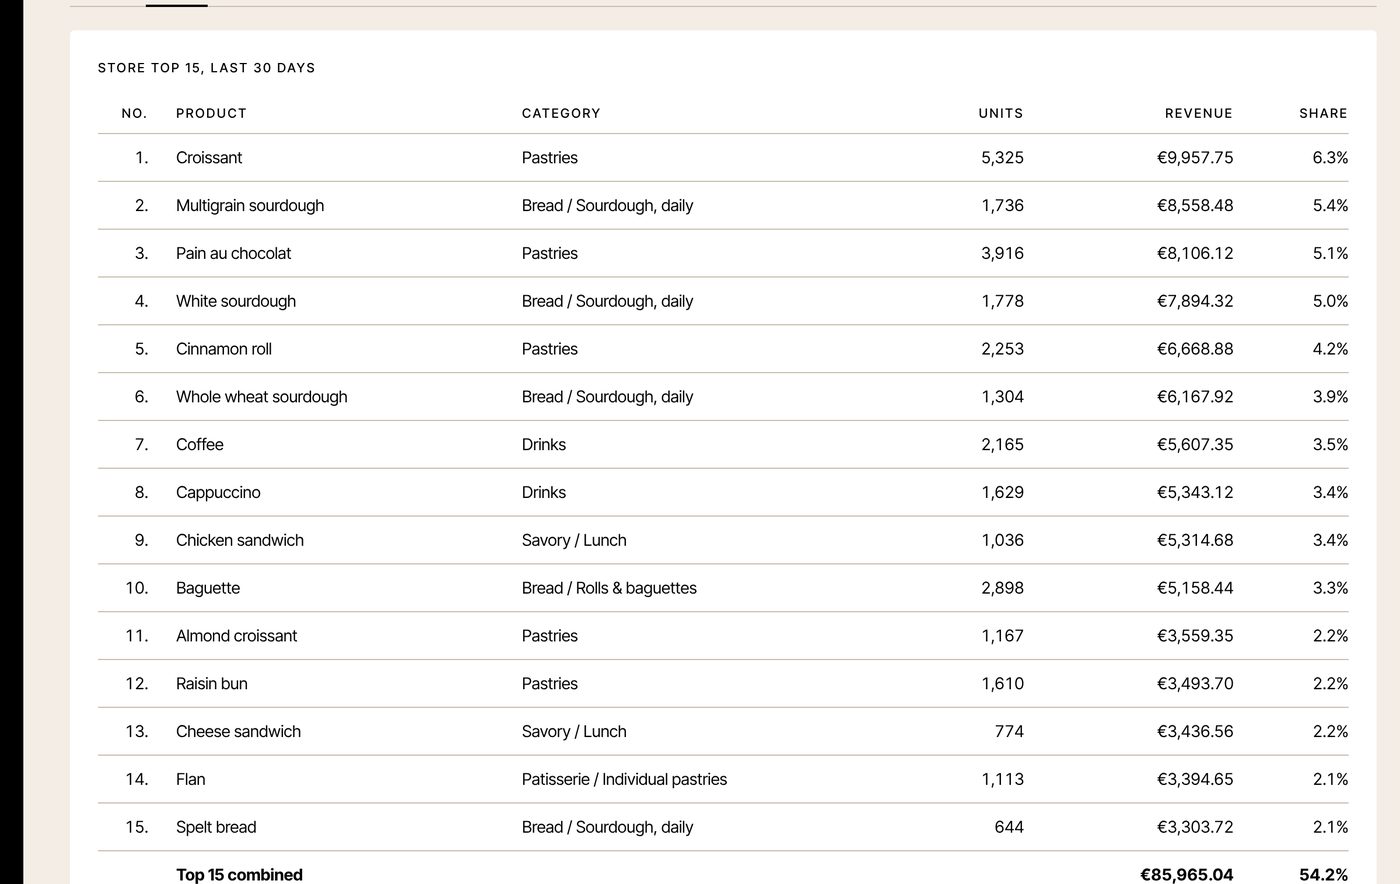
The best and worst sellers for each store. What's climbing, and what has dropped three periods in a row. Which small part of the product line brings in half the sales. And which product group peaks at which hour of the day.

Renard Bakery platform · demo data
Products screen with the best and worst sellers, demo data
04

The forecast

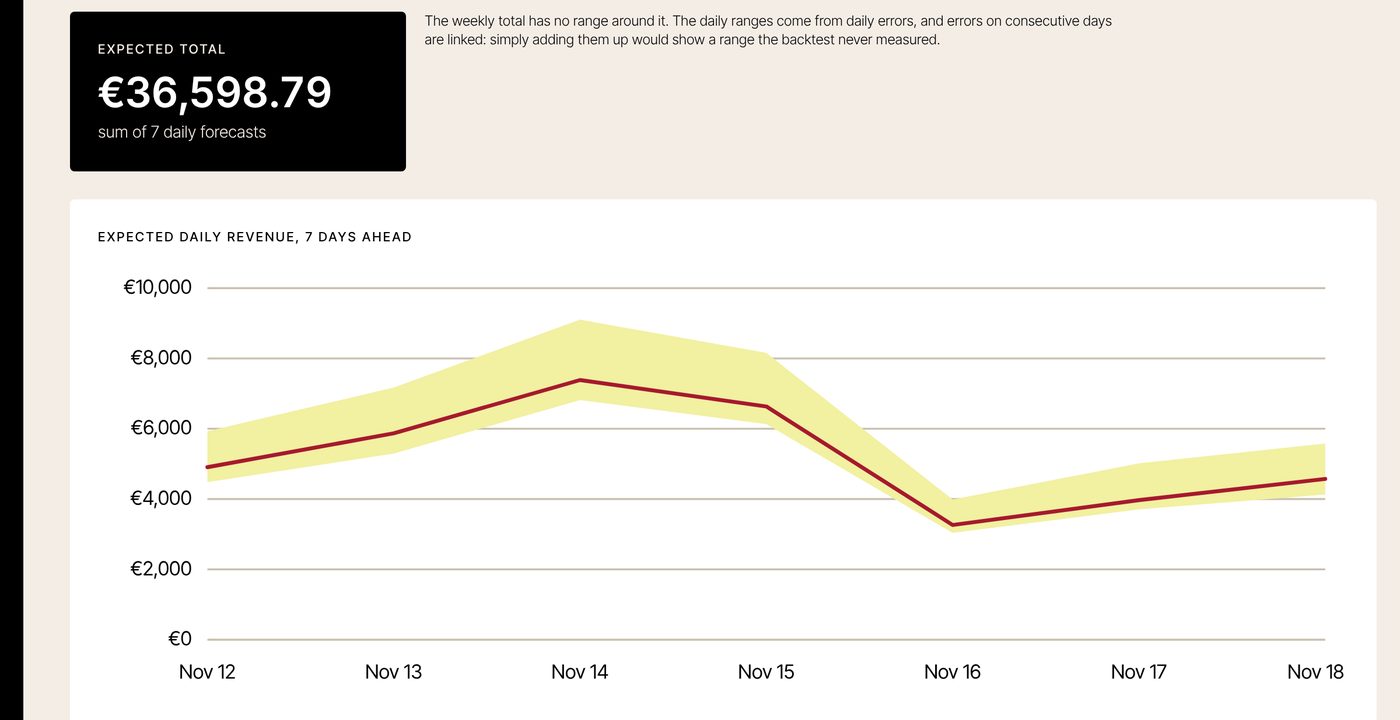
Seven days ahead, with expected sales for each day plus a low and a high estimate. The model looks at the day of the week, recent sales levels, school vacations and the weather. It also grades itself daily: next to each prediction you see what really happened. Tested against more than 400 days of history, it was off by about 8 percent of daily sales on average.

Renard Bakery platform · demo data
Forecast screen showing seven days ahead with a range, demo data
05

From numbers to action

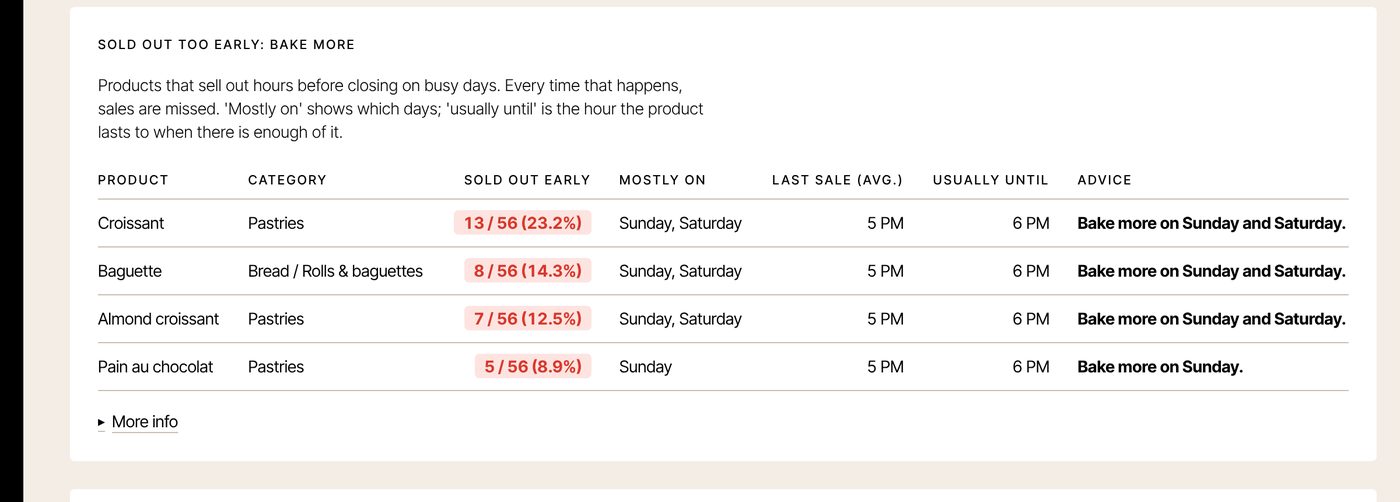
This is the screen where numbers turn into decisions. It shows which products sell out too early on busy days, which means lost sales you won't see anywhere else. It flags products that have been sliding for months and might be worth dropping. And it points out which weekday is slow enough for a top product to deserve a promotion.

Renard Bakery platform · demo data
Actions screen showing products that sell out too early, demo data
06

AI that reads the numbers with you

Claude reads the numbers too. Each day it writes a short piece of advice on what to do today and why, based on the platform's own data.

07

On the phone, in two languages

The platform sits on their home screens like any other app. It runs in Dutch and French because that's how the team works. Anyone who needs an overview for a meeting can put together a report and save it as a PDF.

The platform on a phone, demo data

What runs on its own here

This one has an agent, a workflow and a platform. It needed all three.

WORKFLOWThe numbers pull themselves in.

Every night, register sales, Deliveroo, weather and school vacations come in without anyone lifting a finger.

WORKFLOWThe system checks its own data.

Seven automated checks confirm the data is right. If something's off, the screen says so.

AGENTClaude reads the numbers and gives advice.

An AI agent reads the day's numbers and writes up what to do and why.

PLATFORMThe screens management looks at.

Daily sales, channels, products and the forecast, on their phones and in two languages.

Three rules I don't bend

No number without a source.

If we can't back a number up, we don't show it. The screen says it's unavailable and gives the reason. I'd rather show an empty box than a made-up margin.

An untested forecast is just an opinion.

Every forecast comes from a model that was graded against the past first, and the platform shows its track record.

No customer data.

The database holds only aggregated sales figures. There are no names and no addresses. It's hosted in the EU, every user has a personal login with two-step sign-in, and a data processing agreement is in place.

05

How we worked together

From week one the team had their own space in my hub. It held the project broken into phases, tasks for each person with a deadline, the meeting notes, and a place to leave feedback. We had a short status meeting every Thursday. They also got a shared Claude Team workspace so they could start using AI themselves.

It wasn't a straight line. We were in the middle of summer vacation season, and the second store opened right in the thick of it. The first version went online on August 18, six days before the Uccle opening. After that came the real work: sitting down together and going through it screen by screen. What's missing? What's hard to read? What can go?

Their feedback was specific. Make it more businesslike. Use less color. Put today's sales on the first screen. Give the worst sellers their own list. Feedback like that makes a platform better, and it's why I never ship something the people using it haven't tried first.

06

What they get out of it

I don't publish their sales or margins. That's our agreement, and I think it's the right one. Here's what I can tell you:

They use it every day.It's a morning habit, on their phones. This isn't a report someone pulls once a month.
Ordering and baking decisions come with numbers.How many of these did we sell on a Tuesday? The answer is two taps away.
Lost sales are visible now.A product that's gone by mid-afternoon used to leave no trace in the numbers.
The product line is a decision now.The worst sellers for each store are on a list, ready to talk through.
Each channel shows its real numbers.Deliveroo looks different once you take out the commission.
The second store had numbers from week one.Uccle has been in the platform since it opened, right alongside Ixelles.

Could you put a dollar figure on all that? Probably. That part is theirs to tell.

Want this for your business?

You don't have to run a bakery. If your systems hold data you aren't using today, this can work for you too.

Get in touch →
07

And it keeps growing

They've been on a retainer since November 1. I keep the platform running, there's a check each morning that the numbers came in, and once a month I verify that the forecast still holds up. Small changes are included. Anything new gets a price first, so there are no surprises.

A next phase is planned for early 2027. The idea is to log each evening what was left over and what ran short, so the platform can turn that into a production list. We'd add margin per product. There'd be a chat where the team can ask whatever they want to know. And there'd be roles, so the stores can work in it along with management.

One more thing: the platform belongs to them. If they ever stop working with me, I move everything to their own accounts. That's written into our agreement.

The timeline

How an AI audit works

Most projects start the same way, and it doesn't take months to get going:

01Intro call

You tell me what you do and where you're stuck. I'll tell you straight whether an audit makes sense or whether something smaller would do the job.

02One day on site

I come to where the work happens and watch. How does work come in? Who decides what? Where does the time go? Which tools are you already paying for?

03The report

Within a week you get a report: where time and money are leaking, your priorities in order, a review of your tools, and concrete proposals in more than one size.

04You decide

Do all of it, part of it, or none of it. If you move ahead with a build, the audit fee is credited in full.

05We build in phases

Your team tests as we go. Nothing ships until the people who'll use it have tried it.

06Retainer

If you want it to keep running and keep growing, we look after it on a fixed monthly retainer.

An AI audit costs $2,000, credited in full if you move ahead with a build.

Book your audit day →

Want to know where your business is leaking?

It starts with one day. I look at how you work today, and you get a report with concrete proposals. What you build after that is up to you.